
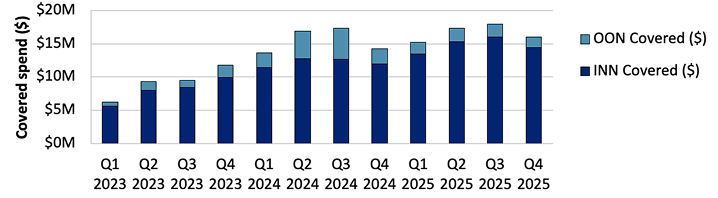
Autism therapy has become the fastest-growing category in covered claims—and the numbers are striking. SmartLight Analytics’ review of client claims processed found that autistic disorder claims surged 63.2% between 2023 and 2025, outpacing every other covered category including routine adult health exams and chemotherapy.1
Fueling the claims growth is the rise in diagnoses, coupled with therapy coverage expansion across Medicaid and commercial plans. As of April 2025, 1 in every 31 Americans is diagnosed with autism, up from 1 in 150 people before 2000. Every state Medicaid program now covers autism services. Self-funded plans that try to rein in costs by tightening utilization controls are bound by parity laws such as MHPAEA.2
Self-funded plan sponsors should monitor their utilization patterns and network strength to ensure their members have access to the services they need.
Covered Services with the Greatest Utilization Growth 2023–2025
| Rank | Diagnostic Code | Description | % Change |
|---|---|---|---|
| 1 | F840 | Autistic Disorder | 63.2% |
| 2 | F411 | Anxiety Disorder | 56.0% |
| 3 | I480 | Paroxysmal AFIB | 53.8% |
| 4 | F332 | Major Depressive Disorder | 45.5% |
| 5 | C61 | Malignant Prostate Neoplasm | 35.4% |
| 6 | Z0000 | General Adult Health Exam | 32.9% |
| 7 | G4733 | Obstructive Sleep Apnea | 27.9% |
| 8 | Z5112 | Antineoplastic Immunotherapy | 23.3% |
| 9 | Z1211 | Colonoscopy | 22.9% |
| 10 | Z5111 | Antineoplastic Chemotherapy | 15.8% |
Rapid Provider Growth Is Driving Utilization—and Scrutiny
Applied Behavioral Analysis (ABA) is the most common therapy approach for autism disorders, applying the principles of behavior change to specific techniques and tasks. To meet rising demand for ABA therapy, there has been a 457% increase in registered behavioral technicians since 2019, now totaling roughly 535,000 nationally. These technicians work with their patients to practice common life skills including household chores, communication, and social interaction.3
But the rapid growth in the technician workforce has outpaced oversight—and that gap is showing up in claims data.
The Rise of In-and Out-of-Network Autism Therapy Spend
Autism Therapy Units per Patient Are Rising and Show No Sign of Slowing
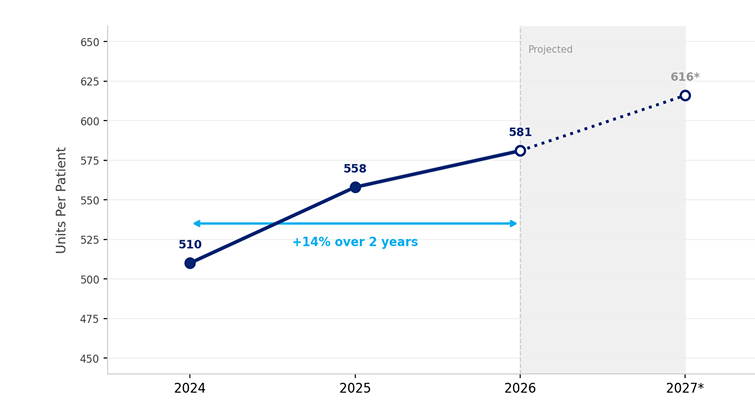
Where utilization climbs this fast, billing scrutiny must follow.
A Wall Street Journal investigation published in March 2026 uncovered ABA therapy providers billing Medicaid as much as $340,000 per patient per year. A subsequent Journal article published in June 2026 reported that autism therapy spending for a coalition of approximately 40 large employers covering 3.5 million lives doubled between 2021 and 2025, reaching $108 million. One major national insurer reported a 300% increase in investigations for likely fraud and abusive billing by autism-therapy providers between 2024 and 2025.3,4
With this growth has come an increase in suspect activity and billing practices—including providers changing names and billing identifiers to avoid detection, and billing for more services than rendered.
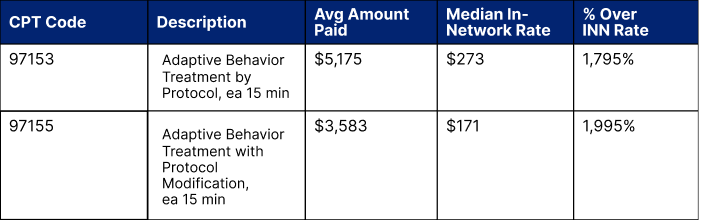
Through monitoring of self-funded group claims, SmartLight identified several providers with questionable billing practices. One practice established nine LLCs, each reflecting similar billing patterns, including excessive per-visit payments, inconsistent alignment with service units, and frequent use of lower-credentialing modifiers. For one self-funded group, SmartLight performed a historical claims review through 2024 and early 2025, finding that this practice received full reimbursement of 100% of billed charges, regardless of treatment volume or duration, resulting in paid amounts exceeding $5.5M across 950 claims.5
Below are some of the findings in the historical claims data review. The carrier has since taken corrective action.
Plan Protection
Billing patterns like these rarely surface through routine claims processing—they require dedicated, ongoing anomaly detection across the full claims history. SmartLight’s ongoing monitoring and clinical investigation can quickly identify these suspect billing patterns and irregularities before they compound.
Early claim anomaly detection matters. When suspect billing is referred, your carriers can take action to protect impacted members and help connect them with quality providers who can deliver the care they need.
- SmartLight Analytics internal data, May 2026.
- Cato Institute, April 2, 2026.
- Christopher Weaver and Anna Wilde Mathews, “The Autism-Therapy Business Is Booming—and So Is the Billing Abuse,” The Wall Street Journal, June 1, 2026.
- Christopher Weaver and Anna Wilde Mathews, “She Charged $29 Million to Treat Just 84 Kids. The Boom in Autism Therapy Is Medicaid’s Fastest-Growing Jackpot,” The Wall Street Journal, March 10, 2026.
- SmartLight Analytics review of client’s retrospective claims processed, November 2025.